Question

Qapp Output to Report or Filtered Table


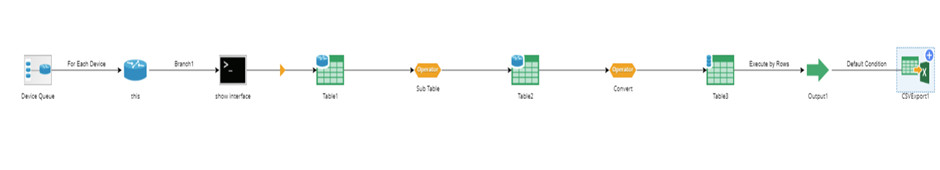
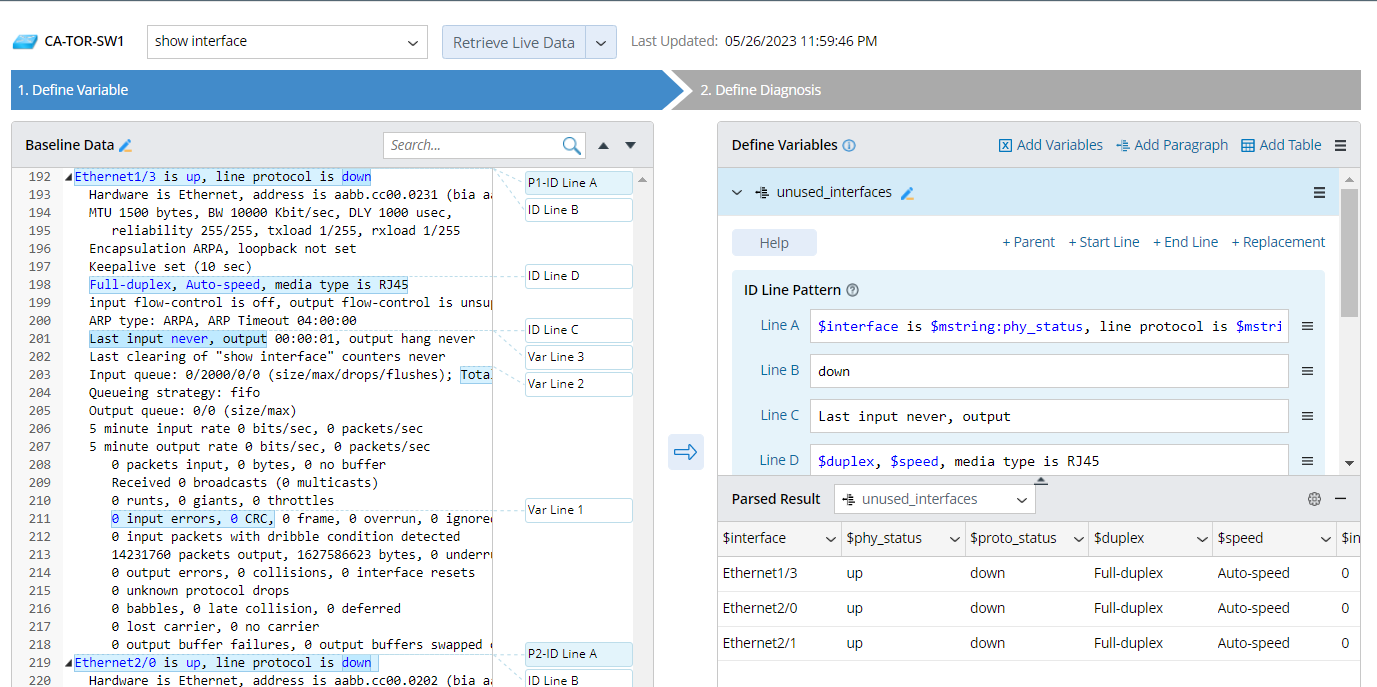
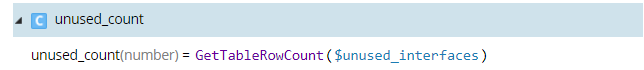
Hello all.  Just wanted to post here to see if this is even possible.  I have a Qapp that creates a CSV file with specific fields.  The purpose is to create a filtered table or report that shows all of our network switches and the amount of unused interfaces.  The CSV just has all the raw data.  I would still need to create some logic that says interface status is either “down” or “administratively down”, the last input is over a year or never, and the media type is one of many options (example:  10/100/1000BaseTX) as I want to exclude fiber interfaces.  For each row in the CSV, I want to just count these.  Then, ideally, the report would simply show 2 columns.
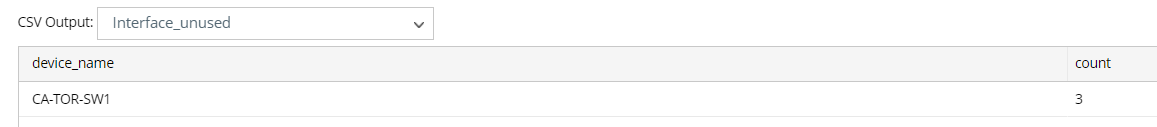
Column 1              Column 2

Switch 1 Name        Number of Unused Ports

Switch 2 Name        Number of Unused Ports

Does anyone know if this can be accomplished within NetBrain or would I just need to utilize something external and work with the raw CSV data?

Thanks.


3 replies

Userlevel 3
Badge

Hi @aours 

I am sure you can do that in NB, just add a Python script and work with Regex and count.

Maybe easier: work on a precise command that will give you the result directly, something like this (depending on hardware):
  show interfaces status | count | inc notcon|disabl
  Number of lines which match regexp = 159

then use the Qapp to recognize the number variable and in the output you can then put it into a CSV file with your text.

Userlevel 3

Hi Aours,

Once you go into canvas and convert the CLI output into table, use sub-Table option to filter out the unwanted fields.

  • Once you convert the CLI output into table, then use the “single table operator” and then use “Sub Table”.
  •  

  • Then click on Sub Table, Advanced to filter out the unwanted fields.
  • Once you click on “Advanced”, new window will pop-up. Define the condition in new window to remove the unwanted fields.


    NOTE: This Advanced option will remove the lines with matching condition - here define the condition that you want to filter

  •  

  • Below is the final table after you removing the unwanted rows based on the condition defined in Advanced section.
  •  

  • Then convert the Table2 into GDT table and then export it via CSV as below SS.
  • Please Let me know if you have any question, I’m ready to help.


Regards,

Kranthi Kumar

Userlevel 3

Hi Aours,

This can also be achieved using Network Intent (No Code Automation) and Intent has capability to generate the CSV report too with simple steps as below

  • Collect all the required variables and filter down based on your requirement as below 
  • Once, we collect all the unused port, we can “GetTableRowCount” function to get the count of all the interfaces

  • Then, we can create a diagnosis to generate the CSV output and below is the sample CSV output file,

  • The above output is for single device. In NetBrain we can “Network Intent cluster” to replicate the above logic to all devices and generate a single CSV with all the unused ports for all devices.

Hope this is helpful. Please let me know if you have any questions.

Regards,

Kranthi Kumar

Reply


Community |  Ideas

Facebook |  Instagram |  Youtube |  Twitter |  LinkedIn
Privacy & Security Statement  |  Terms & Conditions |  Impressum  |  UK Modern Slavery Statement