Hello. NetBrain R11.1
I’d like to pull SFP DOM information to trigger warnings / alarms when threshold values are met.
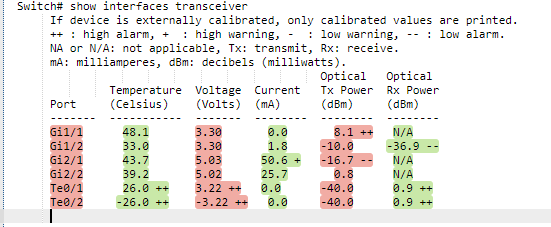
Digital Optical Monitoring (DOM) for monitoring SFP transceiver performance and temperature:
- Enable DOM on the device.
- Assumes DOM capable SFP’s are used
- Example:
SW1(config)#transceiver type all
SW1(config-xcvr-type)#monitoring
SW1(config-xcvr-type)#end
Then use the DOM specific commands to display details:
SW1(config)#sh int gi 1/3 transceiver detail
         Optical                  High Alarm  High Warn  Low Warn   Low Alarm

         Transmit Power     Threshold   Threshold  Threshold  Threshold

Port     (dBm)                  (dBm)       (dBm)      (dBm)      (dBm)

-------  -----------------  ----------  ---------  ---------  ---------

Gi1/3      -27.7                  0.9            -1.0         -11.5       -13.5
          Optical            High Alarm High Warn Low Warn Low Alarm

         Receive Power    Threshold Threshold  Threshold  Threshold

Port     (dBm)              (dBm)       (dBm)         (dBm)       (dBm)

-------  -----------------  ----------  ---------  ---------  ---------

Gi1/3     -7.2                     0.7           -1.0         -20.0       -24.0
Would this be better for a Network Intent or a Qapp? Feels like a Qapp might be better in this case.